Thursday, May 5, 2016

Hadoop - Not a Sha Na Na Song

We can trace modern distributed computing back decades to the first "clusters" of computers that were networked directly together and set working on parts of problems. A good example of which can be seen in the early days of Pixar 3D rendered movies. According to a SunWorld Magazine article from 1995, Toy Story was rendered on 87 dual processor and 30 quad processor 100MHz SPARCStation 20 computers, each having between 192 to 384MB of RAM. The 110,000 frame movie took the equivalent of 46 days of continuous rendering (http://sunsite.uakom.sk/sunworldonline/swol-11-1995/swol-11-pixar.html).

Of course 20 years later those numbers look hilariously small when I'm carrying around an iPhone 6 Plus with a 64bit, 1.1Ghz processor (11x faster than one SPARCStation), with 1 GB of RAM on-chip. But back in the day, the computing power Pixar was using was astounding.

Also in that time frame were many other experiments. Seti@Home, for example, installed a small client program on each participant's PC that would download data sets and do calculations when the PC was idle for a certain length of time. The idea was to leverage the fact that many people leave their computer on 24x7 but it is idle for a large percentage of that time.

Along comes a Google

In 2004 Google employees Jeffrey Dean and Sanjay Ghemawat published their paper, "MapReduce: Simplified Data Processing on Large Cluster"that detailed how Google was able to process such massive amounts of data. They didn't invent the two algorithms, Map and Reduce, but they put them to work in a new way along with a revolutionary idea: the data is much larger than the code, so instead of storing the data on a big hard drive and then moving it to the machine that has the code, break the data into smaller chunks and store the chunks on the same machines as will do the computation. 

Although Google didn't release any code with the paper, they gave enough hints that some smart individuals at Yahoo could recreate their success. I'm a little hazy on the exact course of events and the timeline is only marginally relevant to the rest of the discussion. Suffice it to say that eventually the project went to Apache Foundation and it was named Hadoop after a toy stuffed elephant that belonged to the son of one of the developers. That's also why Hadoop's mascot is an elephant.

Map? Reduce? MapReduce!

The MapReduce algorithm as implemented by Hadoop leverages the Map and Reduce algorithms from Functional programming (a style of programming modeled after mathematical functions) on a cluster of computers called "compute nodes."
  • Map: The map algorithm "maps" some function to each element of an input group. For example, say you have a list of 100 employees and you that you need to give a 3% raise. The Map function could be used on that list to apply the raise.
  • Reduce: Some type of summation of a list. Continuing with our list of 100 employees, this time the list identifies all workers who put in overtime last week. A reduction could be used to sum up all the overtime hours for an end of week report.
Map and Reduce have been used like this for a long time. Dean and Ghemawat's major contribution was the idea of breaking up large data files into smaller chunks and storing those chunks on the compute nodes -- the workers. All of the overhead for this operation is incurred when the data is stored, not as part of the processing. Later, at the time of processing, a scheduler program coordinates which nodes are doing the Map process and which are doing the Reduce process and moves the Map or Reduce to the node containing the data, if needed.

MapReduce, as it is implemented in Hadoop, processes data in many steps. The "hello world" example is counting word occurrences in some large body of text, such as the collected works of Shakespeare. For example:
  • Data is loaded onto the Hadoop Distributed File System (HDFS) where it is segmented into blocks and the blocks stored on compute nodes (with redundancy for fault-tolerance).
  • The MapReduce job is started from a master node and the code is distributed to the compute nodes.
  • The mappers read their local data files, breaking sentences apart at the spaces.
  • The mappers send a big list of each word it encountered along with the number 1 for each, even if there are repeats.
  • An intermediate process shuffles the output from all the mappers and sorts it into lists containing multiple occurrences of a single word and the number 1 for each occurrence.
  • These shuffled lists go to reducers which simply sum all the 1s in the list and outputs one word and the sum.
  • All the reducer outputs are gathered and presented as the final answer.
    Image courtesy of Wikimedia Commons: https://commons.wikimedia.org/wiki/File:WordCountFlow.JPG
The image above showing the workflow a a MapReduce job could be considered a type of "Directed Acyclic Graph." Wait a minute! Any idiot can see there's no X-Y axis - how can that be called a graph? Well, it's a different kind of graph that comes from "Discrete Math" - a branch of mathematics that Computer Scientists study and is kind of a mish-mash of many disciplines. The point is, each box in the image is called either a "node" or a "vertex" and each line is called an "edge" and with the arrows you can see that processing starts and follows a well-defined path.

In the next few posts we'll look at why we need tools like MapReduce and some alternatives that have been developed in the last few years.

Monday, April 25, 2016

Spreading the... love?

I originally started this blog as a place to explore and discuss topics that interest me and projects I'm working on but aside from the scarce nature of posts, I haven't upheld that mission very well. In the beginning I was reticent to discuss my dissertation project for fear of someone else beating me to the punch but at this point I think I've narrowed it enough that I'll be unique even if someone were to find the general outlines.

Speaking of spreading something

So what am I really going to waste your time with? While at least half a dozen smart-ass remarks instantly spring to mind, I'll leave those remarks as an exercise for the readers and mention that much of my research time the past three years has been spent teaching myself the Python language and distributed computing, with particular emphasis on Big Data analytics.

But why distributed?

A few months ago on a rare occasion when I happened to come up for air I noticed that processor speed (X.XX GHz) wasn't really mentioned much in advertising any more but every ad talked about how many cores the computer has. This seemed curious to me so armed with a two year degree in electronics, I set about researching this shift.

In reasonably short order I found a research paper that explained the shift. As with so many things in tech, it all boils down to physics - specifically, the physics of transistors.

Review of computers and electronics

First, recall that three of the most important computer subsystems -- CPU, RAM, and ALU (Arithmetic Logic Unit) -- are composed in large part of transistors and transistors have been getting smaller on a fairly regular basis (Moore's Law).

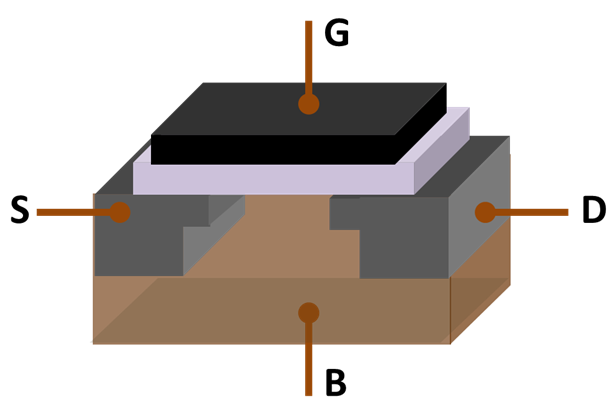
Now if we look at a transistor (right) we see four areas of interest:
  • G - Gate
  • S - Source
  • D - Drain
  • B - Body
Transistors are made through a process similar to photography: areas of the silicon are masked and unmasked areas are treated in some way, then the mask is washed off and a different layer is masked.

On our transistor to the right, imagine that the S and D areas have been bombarded with negative ions making a negatively charged region. Then the area under the gate is bombarded with positive ions and an insulator is placed on top. This creates an NPN field effect transistor (FET). Metal wires are connected to the S, D, and G areas. When a positive voltage is applied to the gate, positive charge in the area under the gate is repelled creating a negative channel and current flows from S to D.

The problem: as transistors get smaller all of those regions get smaller. Remember that the gate is the actual "switch" part of the switch and it has an insulator under it to help control the voltage applied to it. But if that insulator gets too thin then some voltage will leak through even when it isn't wanted. Thus the transistor can not be definitively "on" or "off." That's where we are right now. We do not have the ability to make transistors any smaller and still control the gate leakage.

For this reason, we've stopped trying to stuff more transistors into a smaller space and started to focus on ways to do more things at the same time. Thus multi-core CPUs.

Divide and Conquer

Computer science has acknowledged the power of dividing a problem into smaller pieces and then solving the small pieces simultaneously. This is the driving force behind two bedrock algorithms: Binary Search and Quicksort.

Now, let's imagine you have a task going to the CPU that can be broken up into pieces - and a surprisingly large number of tasks can be -  it might look something like below:
Perhaps each grey rectangle is a part of a list of numbers and the task is to see if a specific number exists in the whole list. It is reasonably easy to see that searching 1/4 of the list takes less time than the whole list, and doing all four of those quarters simultaneously is again an optimization. Thus the idea of multiprocessing with multi-core CPUs.

Next time we'll talk about Hadoop and MapReduce.

Tuesday, January 26, 2016

Thoughts on Teaching Computer Programming

First, let me say that I firmly believe that anyone can learn to write code. If a person is alive, upright, and able to do things like get dressed in the morning or feed themselves they have the skills - namely problem solving and the ability to formulate and then follow steps in an orderly fashion. That being said, I often struggle with helping newbies connect the "real life" skills to the world of programming. I started learning programming more than 30 years ago - I have trouble understanding the problems that new programmers have.

I often think on this problem and I am constantly trying new approaches to help students learn how to approach programming tasks. One such effort is to point out to students that the computer must go through exactly the same steps that they do, just that the steps are smaller.

One example I use is to sum a column of numbers. Usually when I ask students how to perform the task I get answers like, "Just add up the numbers!" Well, yes, but is that the way you really do it? You can look at a column of numbers and instantly know the sum? Or do you perhaps do some other steps that you're taking for granted?

This morning I had a bit of an epiphany on the topic while taking a shower (where many of my best epiphanies happen). Earlier in the quarter we had an exercise where I asked students to write instruction steps for the new "Lunch-A-Matic 2000 Peanut Butter and Jelly Sandwich Making Robot" keeping in mind that a robot ONLY knows how to do what you tell it. When all the students had handed in their instructions I pulled out bread, a knife, peanut butter and jelly and we attempted to make a sandwich based on student instructions. The key word is "attempted." Only 1 student remembered to take the twist-tie off the bread container :).

The epiphany this morning was in the realization that humans think in terms of functions. To put it another way, if you were to try to teach a 6 year old child how to make a PB & J sandwich when they had never been allowed in the kitchen before, you would have to say every small step:


  • Walk to the cupboard
  • Open the cupboard
  • Look inside the cupboard
  • Choose bread type
  • Reach dominant hand into the cupboard
  • Grasp the bread 
  • Remove bread from the cupboard
  • Close the cupboard
  • Walk to the counter

etc.

But after making a few PB & J sandwiches, it is possible to tell that same child "Go make a PB & J sandwich" without guiding them through all of the steps. In other words, the set of steps have become a function call!

The same type of thing can be seen with driving. When we first learn how to drive, it looks and feels like an insurmountable task with all the details one must keep in mind. But as we get experience driving becomes automatic and we don't really think about all the steps and details that go into the activity. "Driving" to work or to the store becomes a parameterized function call.

Armed with this analogy, it looks like my task as a professor of Computer Science is to help students look inside those functions and remember all the little steps.

Wednesday, May 27, 2015

Loopholes and Star Trek’s Moneyless Society

A recent paper in the "Futuring and Innovation" class asked us to write about a sociotechnical plan in a real or fictional organization. As I was reading the definition of "sociotechnical" (http://en.wikipedia.org/wiki/Sociotechnical_system) the first thing that came to mind was how ST:TNG mentioned a few times that they don't use money. As a matter of fact, I remember an episode (http://en.memory-alpha.wikia.com/wiki/The_Neutral_Zone_(episode)) where The Enterprise picked up some people that had been in suspended animation for a few hundred years, one of which was a "Type-A" businessman that couldn't accept the way society and business had changed in the intervening years.
http://en.memory-alpha.wikia.com/wiki/The_Neutral_Zone_(episode)?
file=Offenhouse_on_bridge.jpg
 
To quickly summarize, my question to myself was, "If money no longer existed, meaning basic needs of housing, food, clothing, etc. are provided, then what is the motivation to get up and go to work in the morning?" Ideally, people would be free to pursue whatever interests them rather than whatever has the biggest paycheck (although admittedly sometimes those two intersect). I then went on to analyze human motivational systems: pain avoidance vs. reward seeking, but that's not the point of this blog entry.
 
The purpose of this blog is to discuss organizations had good plans but for reasons out of their control, it all went wrong. In "Best Laid Plans," William Sherden (2011) devotes Chapter 7 to "Perverse Adaptations," stories of how plans with good intentions were somehow subverted, often causing more harm than the original situation the plan was supposed to improve.

For example, In 1975 the Energy Policy Conservation Act was passed in response to the 1973 oil embargoes. This legislation mandated that automobiles would have to get a minimum 27.5 mpg while trucks would have to get 21 mpg. Sherden explains that prior to the act a variety of cars with lower mileage were produced, including the station wagon but with the passing of the act, those cars went off the market. To fill the gap for a family cargo-hauling car, manufacturers invented the SUV which, incidentally, was built on a truck chassis allowing it to use the 21 mpg standard. As SUVs became more popular, consumers switched from more fuel-efficient cars to SUVs, thus actually using more fuel than before.

What loopholes might exist in Star Trek's moneyless society? In a world where a replicator can make food, clothing, furnishings, gadgets, etc., the only things that would have value would be handmade goods but what is my motivation for making pottery coffee mugs or over-the-sofa paintings if I don't get paid for it? It seems like some sort of barter system would have to exist - handmade or rare goods for handmade or rare goods.
 
But what if I don't produce anything handmade? Would I be destined to always have "cheap" replicated goods? Or would there exist some form of black market currency to fill the gap? Perhaps that is the purpose served by the "gold-pressed latinum" the ferengis lusted after.

Given humans' competitive nature coupled with their desire for status (humorous proof here: http://www.sciencechannel.com/tv-shows/outrageous-acts-of-psych/outrageous-acts-of-psych-videos/vip-bus-experience/) it seems a black market barter system would be a loophole that is certainly exploited.

Reference:

Reference:
Sherden, W. A. (2011). Best laid plans: The tyranny of unintended consequences and how to avoid them. ABC-CLIO.

Monday, May 18, 2015

Go Car, Go

This is a continuation of the autonomous car theme. I've created an animated slideshow that discusses some of the benefits.


For more information, see my previous post: Prediction Analysis: Autonomous Cars in Vancouver.

Thursday, May 14, 2015

Prediction Analysis: Autonomous Cars in Vancouver

Every time I read about autonomous cars - the Google mapping car, for example - or the 2011 Nevada legislation authorizing autonomous cars I think back to watching The Jetson's as a kid and all the predictions about flying cars. I _still_ want one, dammit!

However, according to a report last February to the Victoria Transport Policy Institute, autonomous cars may be a closer reality than flying cars  (Litman, 2015). The report exhaustively examines production timelines, estimates public acceptance, and the pros and cons of four different levels of autonomy in cars.

Briefly:

Level 1 - Function Specific Automation: Things like cruise control, lane guidance and hands-free parallel parking. Many higher end cars already have these features implemented.

Level 2 - Combined Function Automation: Multiple integrated functions like cruise control with lane centering. Under certain conditions the driver can be hands- and feet-off pedals but must be aware and able to take control.

Level 3 - Limited Self-Driving Automation: Driver can rely on car for all functions, including safety, under certain conditions and is not expected to monitor the road all the time but should be able to take over control if needed.

Level 4 - Full Self-Driving Automation: Suitable for non-drivers, the vehicle monitors all road conditions with no expectation of passengers being able to assume control.

Obviously, the different levels have different pros and cons as well as progressively later predicted implementation dates.

Although some car manufacturers predict having Level 3 cars ready for mass market by 2018, reality is that the feature will most likely be expensive and take a considerable amount of time to gain widespread public approval and adoption. The report lists various automotive innovations and their time to widespread adoption as guidance for the timeline. For example, automatic transmissions were developed in the 1950s but weren't really widely adopted until the 1990s, and hybrid vehicles have only about a 4% market saturation despite being on the market for 25+ years.

Some of the advantages that are analyzed include increased mobility for non-drivers such as the elderly or disabled, the ability for individual drivers to rest or work on long commutes which also promotes housing farther away from the place of employment (which may have lower property values, better schools, etc.), potential fuel or insurance savings, and best of all, cars that can drop off the passengers and then park themselves.That final benefit plus the ability to read or work during my commute would make the feature worth quite a bit to me.

Sadly, the report cites a recent poll that revealed general support for autonomous cars few respondents would want to pay for a fully autonomous features and expressed concerns over safety and privacy.

Maybe they are another flying car, after all.

References
Litman, Todd, author. (2015). Autonomous vehicle implementation predictions: Implications for transport planning. Retrieved from Victoria Transport Policy Institute website: http://www.vtpi.org/avip.pdf

Monday, May 11, 2015

A Lack of Planning On Your Part...

...Sometimes does cause an emergency on my part.

Continuing in our vein of forecasting and scenario planning, today I'm going to look at the unintended consequences of the U.S. Energy Policy Act of 2005 which required the addition of ethanol to gasoline to reduce fossil fuel dependence and promote cleaner air. According to William A. Sherden in his book "Best Laid Plans: The Tyranny of Unintended Consequences and How to Avoid Them," (2011) the 2005 Act called for the use of 4 billion gallons of ethanol in 2007 ramping up to 35 billion gallons by 2017 (only 2 years from now, BTW).

On the surface, of course, the 2005 Act looks to be a step toward breaking us free from non-renewable resources and moving toward renewable ones such as biomass fermentation -- a direction we as a species MUST go.

Unfortunately, as seems to happen all too often with political initiatives, someone didn't do their science. David Pimentel of Cornell University, however, did do the science and shows us that there is no energy benefit to using biomass-based liquid fuel and the strategy is not sustainable. Let's look why.

U.S. ethanol is primarily produced from corn - a crop that is also used as food for both humans and animals. Growing the corn requires fuel for planting, cultivating, and harvesting the fields as well as transporting the finished product (pipelines tend to contaminate the ethanol with water so it must be shipped via truck/train). Also, many of the pesticides and fertilizers used on the corn have a petroleum base, and don't forget about the heat needed for distillation. As a matter of fact, Pimental estimated that ethanol consumes 29% more energy than it creates and only accounts for about 1% of energy production (Sheridan, 2011).

Source: http://www.afdc.energy.gov/fuels/ethanol_production.html
Perhaps worse though are the unintended environmental side-effects. The original goal of offsetting CO2 emissions from automobile exhaust have been cancelled out by CO2 produced growing, refining, and transporting the ethanol and increased corn production in the U.S. Midwest has lead to greater fertilizer runoff, encouraging algae that deplete oxygen and kill fish and other wildlife at the mouth of the Mississippi in the Gulf of Mexico.

Perhaps even worse is the impact to worldwide food production. According to James Conca in Forbes article "It's Final -- Corn Ethanol Is Of No Use" in the year 2000 90% of corn produced in the U.S. went to feeding livestock and people --  many of which were in impoverished areas. However, in 2013 40% of corn production went to ethanol and 45% to livestock leaving just 15% of corn production going to humans. Couple the facts above with the facts that the U.S. produces 40% of worldwide corn and 70% of worldwide corn imports come from the U.S. and we can begin to see the full picture of ethanol's impact on world food supplies.

Hindsight is 20/20 as they say but one has to wonder that none of these effects were uncovered in the pre-Energy Policy Act of 2005 analysis

Reference:

Sherden, W. A. (2011). Best laid plans: The tyranny of unintended consequences and how to avoid them. ABC-CLIO.

Conca, J. (2014, April 20). It's Final -- Corn Ethanol Is Of No Use. Retrieved from http://www.forbes.com/sites/jamesconca/2014/04/20/its-final-corn-ethanol-is-of-no-use/2/